How I Made My Timcam Line Tracker
How I made my Timcam line tracker, how I’m using it, and future plans.
Tags
Tech stack
- Programming
- Image Processing
- Python
- CV2
- YOLO26
- FastAPI
I attend UBC Okanagan, and we've got a Tim Hortons on campus. However, the line can get quite long, and my friends and I wanted a way to check it without having to dig through the university website to find the Timcam feed. We wanted something faster that we could check at a glance, without having to count people in line.
I decided to dig into the website hosting the Timcam feed and found that the video was being served in a format I’d never heard of, with a .m3u8 extension. After some research, I learned this was an HLS stream, basically just a playlist of video segments.

From there, I figured it wouldn’t be too hard to set up a computer vision pipeline to estimate the line size and serve it through an API, which I could then use on my website to display the current count.
I also figured that since I'd be consuming their camera feed, it would be a good idea to get the university's blessing—lest the project get taken down once it got popular. I reached out to UBCO IT; they were very supportive and gave me the green light to use the feed for this purpose, with the requirement that I set terms for the API to be for educational/non-commercial use only.
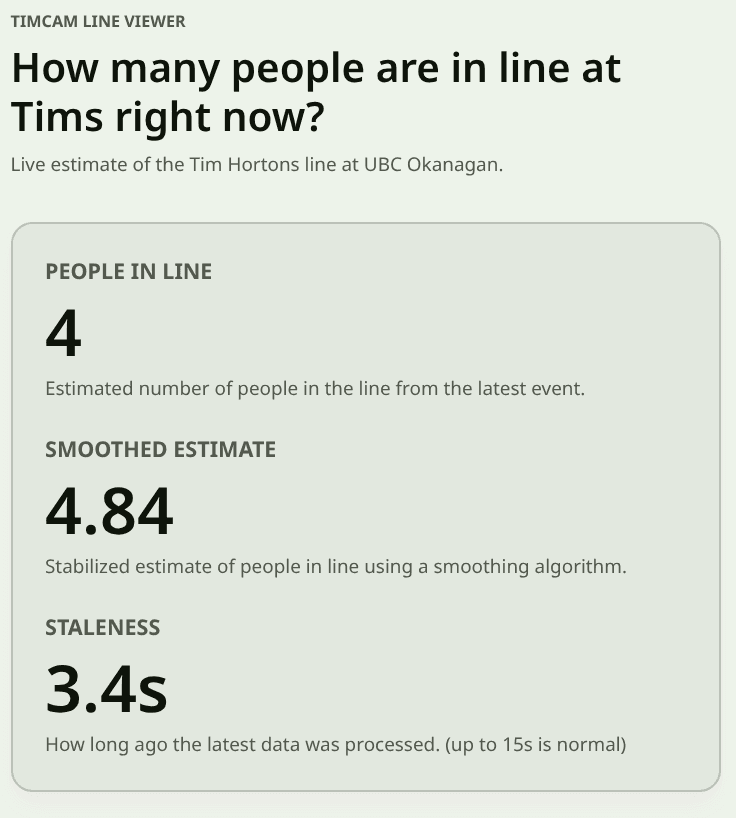
Here is the live count, if you're curious:
People in Line
—
Estimated number of people in the line from the latest event.
Smoothed Estimate
—
Stabilized estimate of people in line using a smoothing algorithm.
Staleness
—
How long ago the latest data was processed. (up to 15s is normal)
Show Recent Max Counts
These max values may be more accurate at reflecting how long the line actually is, since the raw count can fluctuate a lot. It also may just show you an overestimate, I've added it for fun.
Max Count (Last 20 Updates)
—
Highest raw count across the last 0 events.
Max Smoothed (Last 20 Updates)
—
Highest smoothed estimate across the last 0 events.
20
Controls how many recent events are used for the max values.
Feedback
I can drop this in here easily because I'm using MDX for my posts, check out my post about this site if you want to learn more about that.
The VisualCounterAPI
Pretty quickly, I knew I’d be using Python for the computer vision part, and FastAPI for serving the API once I confirmed that FastAPI supports Server-Sent Events (SSE).
The project quickly expanded from just counting the Timcam line to being a general-purpose computer vision API that can be used with many camera sources (at the moment, giving each its own processing thread), with endpoints for each camera’s count.
Here I'll go through the structure of how the project creates the API, roughly in order of the pipeline steps.
Ingesting the Video Feed
It was super simple to grab frames with OpenCV’s VideoCapture pointed at the .m3u8 URL, and I was pulling frames in in no time. Once I ran the API for more than a few minutes though, I realized the feed would occasionally time out.
I added error handling to catch this and attempt a reconnect if it looks like the feed has stopped working. At first, it treated normal gaps between HLS segments as a failure and reconnected unnecessarily (which messed with the pipeline even though the feed was fine). Extending the time threshold before declaring a failure and reconnecting seems to have fixed it.
Person Detection
I'd previously used YOLOv8 when working on computer vision for autonomous drone landing with ARRC, and I found it very easy to use. I checked to see if it had built-in weights for person detection (it does), then set up a simple pipeline to pull the video feed, run it through the model, and count the number of people detected in each frame.
Then came trying to determine how many people were actually in line, which is more complicated than just counting people in the frame. There are often people walking around or standing nearby, and people near the line can easily look like they’re in it to the model.
I ended up setting up a Region of Interest (ROI) system where I specify a polygonal area in the frame using normalized coordinates from 0-1. I only count people whose detections fall inside that polygon (based on the center of their bounding box). This worked pretty well, and I was able to get a fairly accurate count most of the time.
Performance Optimizations
I knew I'd be running this on my homelab, which boasts my old i7-6700 CPU and no GPU, so I knew performance would likely be an issue, especially since I wanted to serve the data in real-time. To try and get ahead of this, before I did any optimization on my own, I found OpenVINO which could be used to optimize the model for Intel CPU inference, and give me a speed boost without me having to actually use my brain.
However, I eventually noticed that I was lagging behind the live feed while testing on my laptop (also an Intel CPU), and missing a lot of people. That was a problem, since I wanted this to be as accurate and up-to-date as possible. I ended up implementing a few optimizations to speed up the pipeline, such as only processing every nth frame, cropping the feed before processing, and adding an (attempted) limiter on how many frames are processed per second while dropping excess frames.
What helped the most though, was making a configurable n-length queue of the most recently received frames, tossing the older ones, and pulling from the queue when I could process a new frame. This way, I could ensure I was processing recent frames and not falling behind, even if I “lost” intermediate frames.
Of course, then I realized YOLO26 was out, and it was much faster and more efficient, so I switched to that, which helped a bunch.
I think the biggest improvements were the cropping, the model switch, and the queue, which together got me much more accurate and up-to-date results.
I could probably turn off the queueing on my server and still stay up to date with the feed now, but I would rather keep it super up to date than risk falling behind again, so I left it in.
Here's a picture from the feed with the Cropping area outlined in blue, and the ROI outlined in yellow.

Smoothing the Data
Even with the faster model, the count can still be a jumpy and inaccurate, especially with the line doubling back on itself, people wearing black against the black windows of the Tims, and the low resolution of the camera feed.
I made a modular smoothing system where I can implement, register, and swap between different smoothing algorithms. I implemented a Time-Weighted Average (with some LLM assistance) and set that as the default. This helped a lot with the jumpiness, and makes the count feel much more stable.
I could add more, but the TWA seems to be doing a pretty good job, and I don't want to overcomplicate things.
Serving the Data
I'd already mentioned that I'm using FastAPI to serve the data, and that I wanted to use Server-Sent Events (SSE) to stream the data in real-time to the frontend. This ended up being pretty straightforward to set up, and I was able to get a stream of the line size up and running in no time.
The API structure looks like this:
GET / - information about the cameras provided by this API
GET /{camera_name} - information about a specific camera, including available ROI names
GET /{camera_name}/rois - the coordinates of the ROIs for this camera
GET /{camera_name}/count - the count from the default ROI
GET /{camera_name}/count/?roi_name - counts from that preset ROI
GET /{camera_name}/count?roi=0.3047,0.4514;0.3516,0.3333;0.5625,0.3333;0.5625,0.4514 - the count from a custom ROI specified by the query parameter
GET /{camera_name}/count/stream - a stream of the count from the default ROI; supports the same roi and roi_name query parameters as the non-streaming endpoint
We hold the results from the most recently processed frame in memory, so the non-streaming endpoints just return that. The streaming endpoint keeps a connection open and sends updated counts whenever a new frame is processed.
Here is an example of the output when accessing the timcam count:
{
  "camera": "timcam_cropped",
  "roi_name": "approx_line_area",
  "roi": [
    [0.185185185185185, 0.0967741935483871],
    [0.074074074074074, 0.741935483870968],
    [0.87037037037037, 0.741935483870968],
    [0.925925925925926, 0.0967741935483871]
  ],
  "count": 6,
  "smoothed_count": 5.1525995016098,
  "smoothing_type": "TimeWeightedAverageSmoother",
  "timestamp": 1773852303.66748,
  "timestamp_iso": "2026-03-18T16:45:03.667483+00:00",
  "sequence": 65462
}
I’m planning on adding a concise mode to reduce bandwidth usage for clients that just want the count, smoothed count, and timestamp.
I’ve also added support for API keys and for disabling the custom ROI query, since I don’t really want people hammering it with custom ROIs and causing performance issues. Both are configurable via the config file or environment variables.
Configuration
Who doesn’t love a big ol’ YAML config file?
I wanted to make it easy to configure the API without having to change the code, so I set up a config file that can be used to specify things like the camera feed URL, the ROIs, the smoothing algorithm, and various other settings.
I'll drop part of the config file I'm using for the Timcam API here, click here for the full thing
defaults:
  detector:
    type: "openvino_yolo"
    model_path: "models/yolo26s_openvino_model/yolo26s.xml"
    conf_threshold: 0.15
    nms_threshold: 0.6
  smoothing:
    type: "time_weighted_average"
    params:
      window_seconds: 5.0

cameras:
  timcam_cropped:
    source_url: "https://streamserve.ok.ubc.ca/LiveCams/timcam.stream_720p/playlist.m3u8"
    details:
      title: "timcam line counter made with AlteredNode's VisualCounterAPI - for educational / non-commercial use only"
    default_roi: "approx_line_area"
    processing:
      source_crop: [0.33, 0.22, 0.6, 0.53] # [x_min, y_min, x_max, y_max] in relative coordinates (origin top left)
      latest_frame_queue_size: 10
      read_failures_before_reconnect: 2
      reconnect_delay_seconds: 5.0
      ffmpeg_open_timeout_ms: 30000
      ffmpeg_read_timeout_ms: 60000
      every_n_frames: 1
    rois:
      approx_line_area:
        - [0.38, 0.25]
        - [0.35, 0.45]
        - [0.565, 0.45]
        - [0.58, 0.25]
I’ve tested adding multiple cameras to the same API, and it seems to work well. That means I can easily add more cameras in the future if I want to track more lines (or other things), or turn this project into a managed SaaS for computer vision pipelines as a bigger showcase.
The Frontend
At the moment, I just have a simple React component (which you saw near the start of this post) that connects to the streaming endpoint and displays the current line size, and gave it it's own dedicated page at cheyne.dev/timcam It's nothing fancy, but it gets the job done.
I also have a small form in it that lets people tell me how many people are in the line, with a tiny python service also running on my homelab with docker to just log these form responses to a jsonl file for now. I want to use this data to get feedback on the accuracy of the counts and maybe add some sort of accuracy metric in the future, or train a simple regression model to correct for the inaccuracies based on the line size or other factors.
The form is hidden in a dropdown and when people open it, it “freezes” the count display at the latest value so they can submit a report based on that without worrying about it changing while they fill out the form. Once they close the form, it goes back to updating with the live count.
I do plan on improving the frontend in the future by making it so each viewer isn’t opening their own stream connection to the API. Instead, I’d use a single connection on the server side and broadcast the data to all viewers, which should reduce load and make things more efficient. With the current number of viewers it’s not really an issue, and I want to focus on other things for now.
Deployment and Hosting
I'm hosting the API on my homelab, which is my old gutted desktop running Ubuntu Server, and the frontend is tacked onto this site which is hosted on Vercel.
Rate limiting and security are concerns since this runs on my home network, so I have Traefik set up as a reverse proxy on an Oracle Cloud instance. It routes traffic to my home server through Tailscale, which lets me keep the API protected behind a VPN and only expose it to the internet through Traefik (which handles TLS termination, rate limiting, and other security measures).
Additionally, the API is running in a Docker container, which adds an extra layer of isolation. It’s also set up so I can update the config without rebuilding the image, which makes it easy to manage and deploy.
Other Stuff
Before I wrap this up, here's a few other things that I think are worth mentioning:
Ease of use
Nobody will use this if its not quicker and easier than just going to the timcam feed and taking a look, so making it quickly readable at a glance was a big focus for me.
I've also been encouraging those I know to add the page to their home screen on their phones, so its just one tap to check the count before heading to Tims, which has been fun to see people using it and getting value out of it.
Trials and Tribulations
This project has been pretty smooth overall, but there have been a few hiccups along the way.
There were the performance issues I mentioned earlier, which were a bit of a headache to figure out and optimize. There were also some challenges with getting the feed to be stable and not time out, but the error handling and reconnect logic seems to have solved that.
CORS popped its head up when I first forgot to add CORS, then forgot that my website redirects cheyne.dev to www.cheyne.dev (I've since changed cheyne.dev to be the primary) which lead requests from www.cheyne.dev to be blocked. I want it to be a public API, so I've since changed it to allow requests from any origin.
YOLO26 appeared to not work at first, since it output its detections in a different format than YOLOv8, but that was a quick switch to fix.
Future Plans
The reasonable ones
It would be great to add an estimate of wait time based on the line size. I’m thinking of adding something to the live feed that lets people enter how long it took them to get through the line, then using that data to fit a simple linear regression model to estimate wait times from line size. That could be a fun project and add some extra value.
I’m not sure if that would fit within the scope of VisualCounterAPI as-is; alternatively, I could add support for custom plugins (or similar) that do post-processing before sending data out.
Also, just to be explicit: I’m not storing images or doing any kind of identification, it’s purely an aggregate count within a small ROI.
Those features could be added to the software that runs the API, but they would be disabled for the Timcam to keep it in line with the university’s requirements and to avoid any privacy concerns.
I may also reach out to the university about doing a similar thing for the Nonis Field camera, which is a feed of the soccer field, and could be used to count how many people are on the field at any given time, which could be fun to track for the sports teams and stuff.
Even without storing images, I’d love to keep track of the counts over time and make a dashboard to visualize it. That would be a fun way to see trends and patterns, and it could help people figure out when the busiest times are.
I'd been planning on doing this for the courtyard, but with the cropping I needed to get more accuracy for the line, I've cut most of it out.
The less reasonable ones but also really cool
It would be neat to use this API software to make some sort of managed SaaS for computer vision pipelines, where people could just plug in their camera feeds, set up some ROIs, and have it serve the data through an API without having to worry about the computer vision part at all, which could be a fun project and a good way to showcase the capabilities of the VisualCounterAPI.
I did think about it enough to get concerned about the licensing/terms around using Ultralytics YOLO models in a commercial product. Before doing anything commercial with this, I’d want to re-read the relevant licenses/terms carefully (and probably get proper legal advice) rather than assume a particular business model makes it "in the clear".
Wrapping up
This was a really fun project to work on, and I’m happy with how it turned out. It’s been a great way to learn more about computer vision, FastAPI, and building APIs in general, and I hope my fellow students find it useful.
I’d love to keep this running post-graduation. If you’re a student in the future reading this and it’s down, reach out and I’ll probably put it back up! - Its most likely that I moved or something and forgot about it.
If you want to check out the code, it’s all open source on my GitHub (linked at the top of the post). If you have any questions or suggestions, feel free to reach out with the various contacts on my homepage. Thanks for reading!